Olist Project: Part 1: Importing and Understanding the Data with Python
Olist Project: Part 1: Importing and Understanding the Data with Python
Introduction
After completing my first two portfolio projects using Superstore and Northwind, I wanted my third project to focus more heavily on Python and the complete data analysis workflow.
For this project, I chose the Brazilian Olist e-commerce dataset.
The objective is not simply to analyse an existing dataset. I want to demonstrate the complete journey from raw data to a usable analytical application.
The project will therefore follow several stages:
- Importing and understanding the raw data
- Cleaning and validating the datasets
- Creating new variables and preparing the analytical data
- Exploratory data analysis
- Business analysis and visualisation
- Building an interactive application with Streamlit
This first part focuses exclusively on the first stage:
Importing and understanding the raw Olist datasets.
Before modifying the data, I wanted to understand what I had actually received, how the datasets were structured, what information they contained and how they were connected.
1. Project Objective
The Olist dataset contains information about a Brazilian e-commerce marketplace, including orders, customers, products, sellers, payments, reviews and geographical information.
Before performing any analysis, I first needed to understand the structure of the available data.
The objectives of this first stage were therefore to:
- import the datasets into Python;
- identify the different datasets available;
- understand the structure of each dataset;
- inspect the number of rows and columns;
- inspect the data types;
- identify missing values;
- check for duplicates;
- investigate the main identifiers;
- understand the relationships between the datasets;
- identify potential problems that would need to be addressed during the cleaning stage.
At this point, I deliberately did not modify the data.
The purpose was to first understand the raw data before making any decisions about how it should be cleaned or transformed.
2. Project Structure
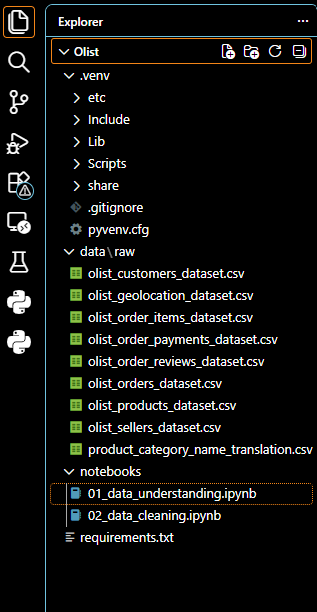
I organised the project so that the original datasets would remain separate from the notebooks and processed data.
The structure of the project is:
1
2
3
4
5
6
7
8
9
10
11
12
13
14
15
16
17
18
Project_3_Olist_Python/
│
├── .venv/
│
├── data/
│   ├── raw/
│   └── processed/
│
├── notebooks/
│
├── src/
│
├── app/
│
├── images/
│
├── requirements.txt
└── README.md
The .venv folder contains the Python virtual environment used specifically for this project.
I kept the virtual environment separate from the notebooks and datasets because the virtual environment is used to manage the project’s Python dependencies rather than store project files.
The data/raw folder contains the original Olist CSV files.
This is important because I do not want to modify the original source data directly.
The cleaned and transformed datasets will later be stored separately in data/processed.
The notebooks folder contains the notebooks used to document the different stages of the project.
The src folder can contain reusable Python functions and scripts as the project develops.
The app folder will eventually contain the Streamlit application.
The images folder will contain images and screenshots used to document the project.
The requirements.txt file will document the Python libraries required to reproduce the project.
Keeping these elements separated makes the project easier to maintain and easier for another person to understand when looking at the GitHub repository.
3. Setting Up the Python Environment
For this project, I created a dedicated Python virtual environment.
Using a virtual environment allows the project to have its own Python dependencies without interfering with other Python projects on my computer.
This is particularly useful for a portfolio project because the required libraries can later be documented in a requirements.txt file.
The main Python libraries used throughout the project are:
- Pandas
- NumPy
- Matplotlib
- Seaborn
- Streamlit
Pandas will be the main library used for loading, cleaning, transforming and analysing the datasets.
NumPy will be used for numerical operations.
Matplotlib and Seaborn will later be used for visualisation.
Streamlit will eventually be used to transform the analysis into an interactive application.
The virtual environment itself is not where I store my notebooks or datasets.
The .venv folder is only used for the project’s Python environment.
My notebooks and project files remain outside .venv, inside the main project folder.
4. Importing the Python Libraries
I first imported the libraries required for the data preparation process.
The main libraries used at this stage were Pandas and NumPy.

Pandas is particularly important because it allows CSV files to be loaded into DataFrames.
A DataFrame provides a structured way of working with tabular data and makes it possible to perform operations such as filtering, grouping, merging and calculating new variables.
At this stage, I only imported the libraries required for the data preparation process.
The visualisation and Streamlit libraries will become more important during later stages of the project.
5. Importing the Olist Dataset
The Olist dataset is not contained in one single CSV file.
Instead, the information is distributed across several related datasets.
The main datasets used in this project are:
| CSV file | Purpose |
|---|---|
olist_customers_dataset.csv | Customer information |
olist_orders_dataset.csv | Orders and order status |
olist_order_items_dataset.csv | Products contained in each order |
olist_order_payments_dataset.csv | Payment information |
olist_order_reviews_dataset.csv | Customer reviews |
olist_products_dataset.csv | Product information |
olist_sellers_dataset.csv | Seller information |
olist_geolocation_dataset.csv | Geographical information |
product_category_name_translation.csv | Product category translation |
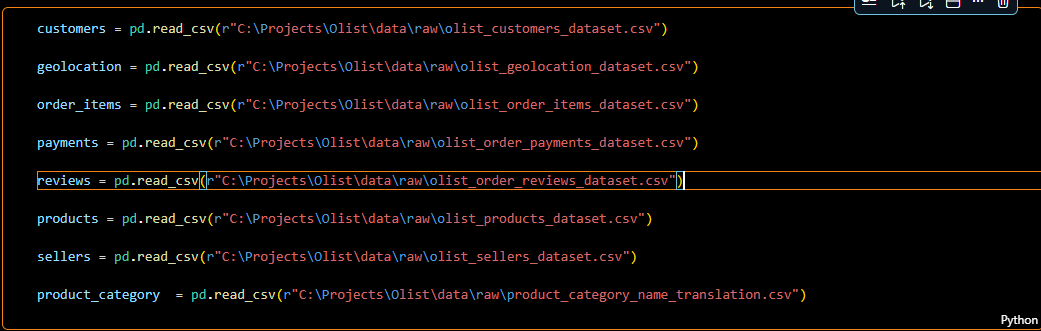
I imported each CSV file into a separate Pandas DataFrame.
For example:
I kept the original files inside the data/raw directory.
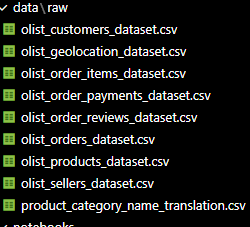
This separation will become useful later because the original data should remain unchanged while the cleaned and transformed versions are created separately.
6. Creating a Dataset Overview
After importing all the datasets, I wanted to obtain a quick overview of their size.
Instead of checking every DataFrame individually, I grouped them into a dictionary.
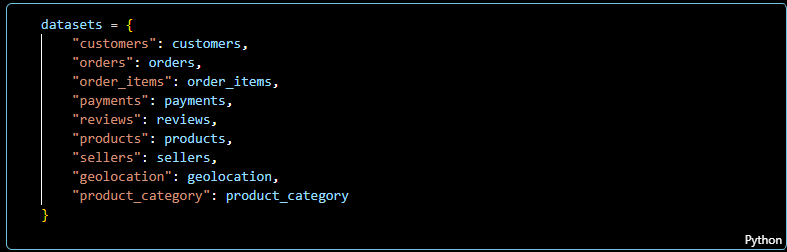
I could then loop through the datasets and display their dimensions:
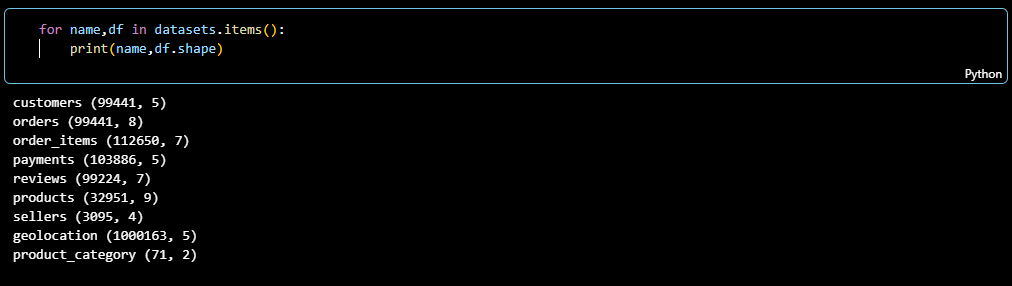
The .shape attribute returns the number of rows and columns contained in a DataFrame.
This gave me a quick overview of the size of the different datasets before starting the detailed inspection.
This first inspection showed that the datasets vary significantly in size.
This is important because the different datasets do not all represent the same type of information.
For example, the orders dataset operates at the order level, while the order items dataset can contain several rows for a single order.
Understanding this distinction is important before attempting to merge the datasets together.
7. Inspecting the First Rows
After checking the dimensions of the datasets, I inspected the actual contents.
For example, I used:
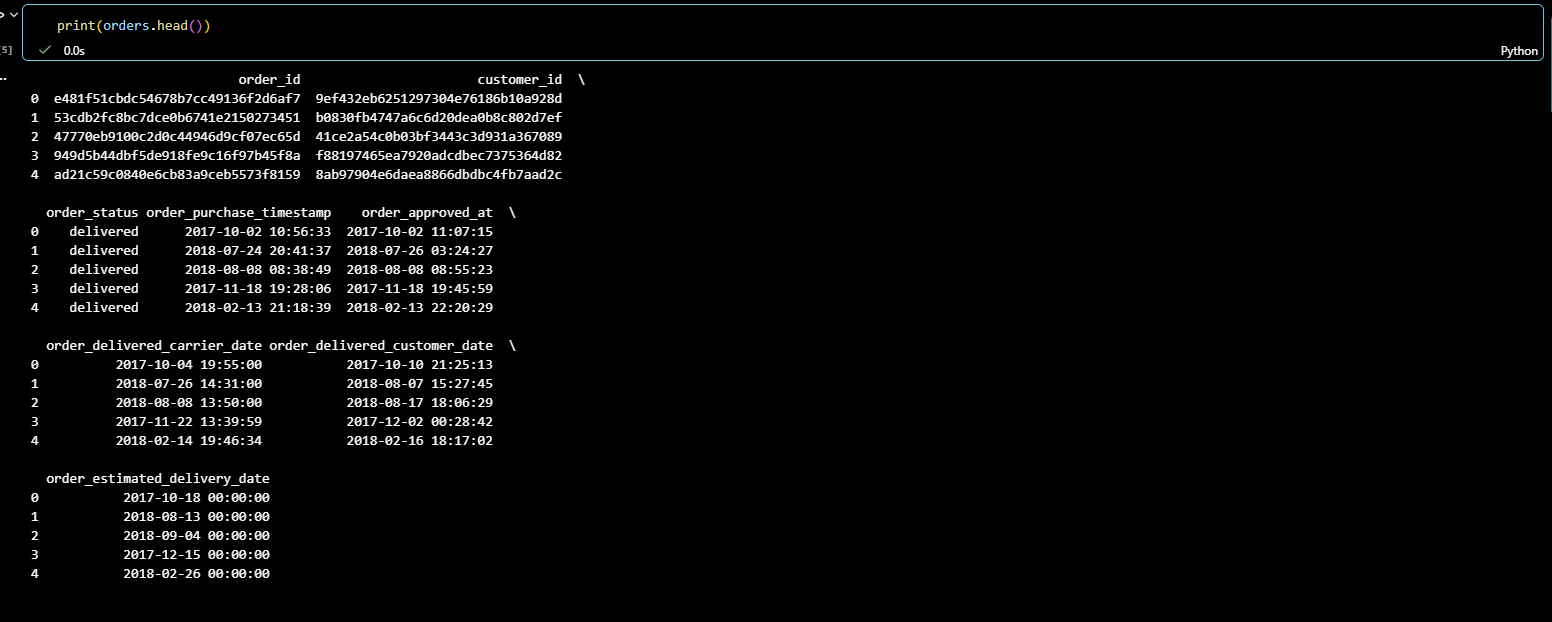
The .head() method displays the first five rows of the DataFrame.
This allowed me to move from simply knowing how large the dataset was to understanding what the individual records actually represented.
I repeated this type of inspection for the other important datasets.
The purpose was to identify:
- column names;
- the type of information contained in each column;
- potential identifiers;
- categorical variables;
- numerical variables;
- date and timestamp columns.
At this point, I was still only investigating the data.
No cleaning or transformation had been performed yet.
8. Inspecting the Data Types
The next step was to inspect the data types and general structure of the columns.
For the orders dataset, I used:
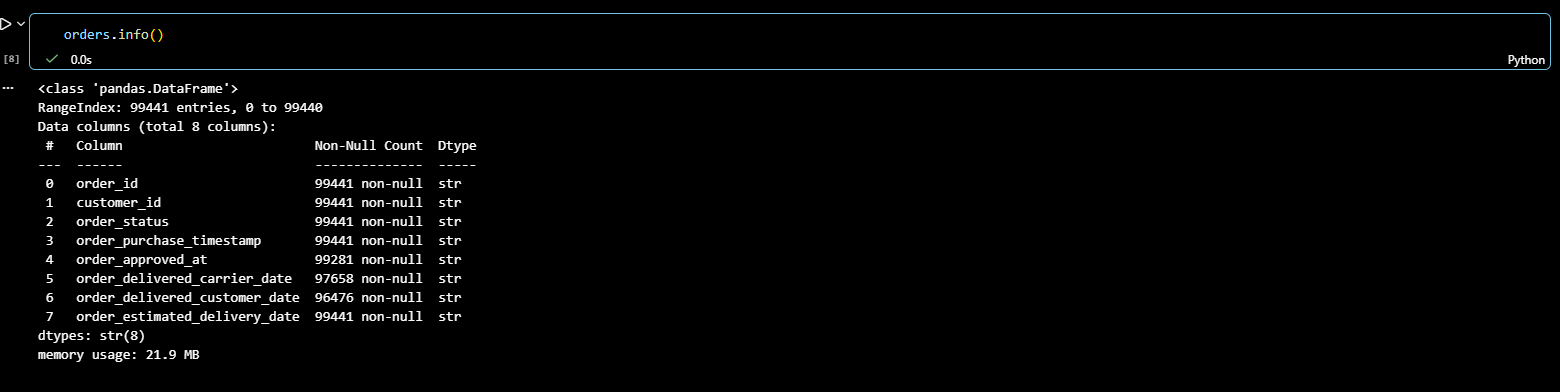
The .info() method provides several useful pieces of information at once:
- the number of records;
- the column names;
- the number of non-null values;
- the data type of each column.
This inspection highlighted an important issue.
Several columns that represented dates or timestamps had been imported as strings rather than as proper datetime values.
For example:
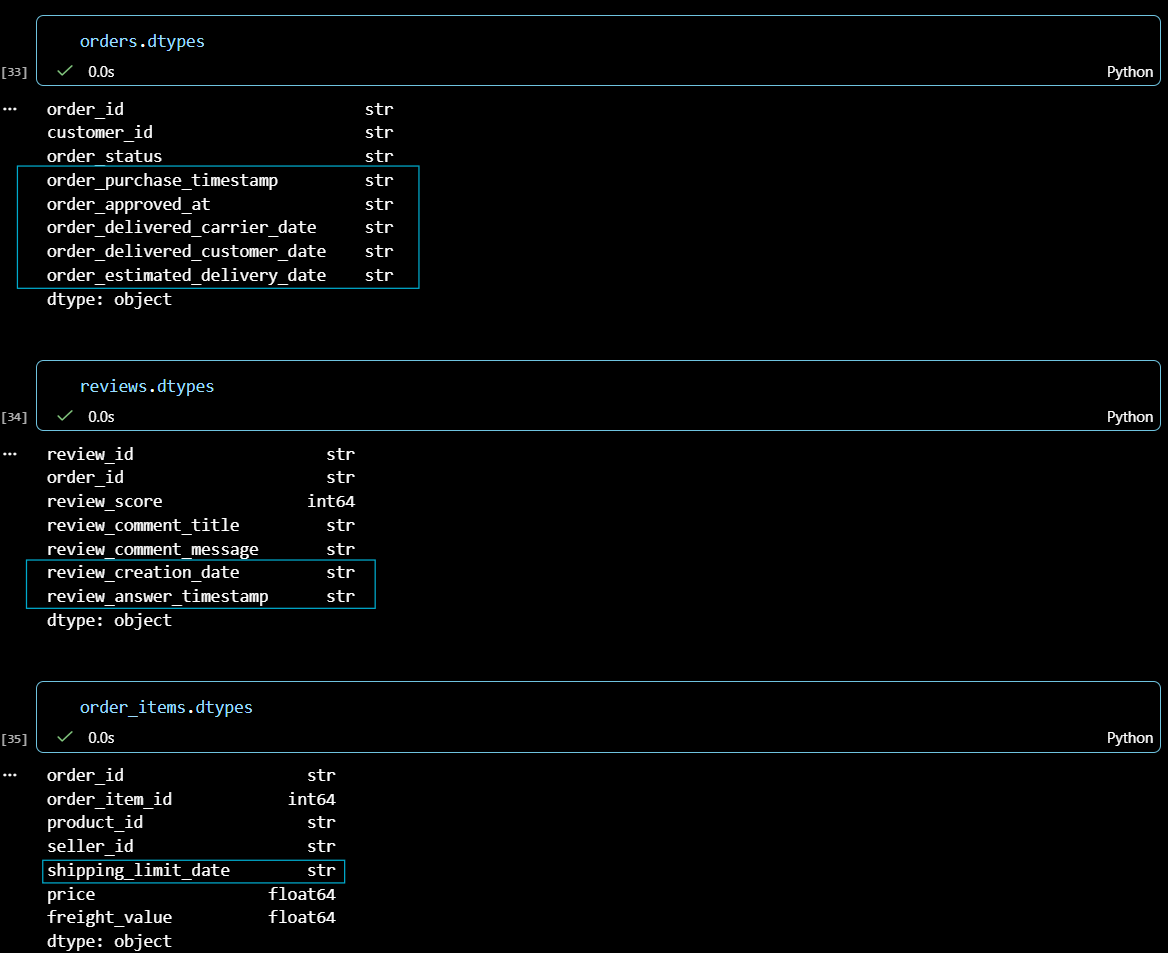
This is common when working with CSV files because CSV files do not inherently enforce a specific data type for a column.
A date can therefore initially be interpreted by Pandas as text.
I did not immediately convert these columns at this stage.
Instead, I recorded the issue so that it could be handled systematically during the data cleaning stage.
9. Identifying Date and Timestamp Columns
During the initial inspection, I identified several columns representing dates or timestamps.
For example, the orders dataset contains:
1
2
3
4
5
order_purchase_timestamp
order_approved_at
order_delivered_carrier_date
order_delivered_customer_date
order_estimated_delivery_date
These columns will be particularly important later because they will allow me to calculate variables such as:
- delivery duration;
- delivery delays;
- monthly order volume;
- yearly order volume;
- seasonal trends;
- weekday purchasing behaviour.
For example, once a timestamp has been converted into a proper datetime format, I will be able to extract information such as the year, month or day of the week.
However, the conversion itself belongs to the next stage of the project.
The purpose of this first post is to understand and document the raw data rather than clean it.
10. Investigating Missing Values
Another important part of the initial investigation was identifying missing values.
I checked missing values across all of the datasets using:
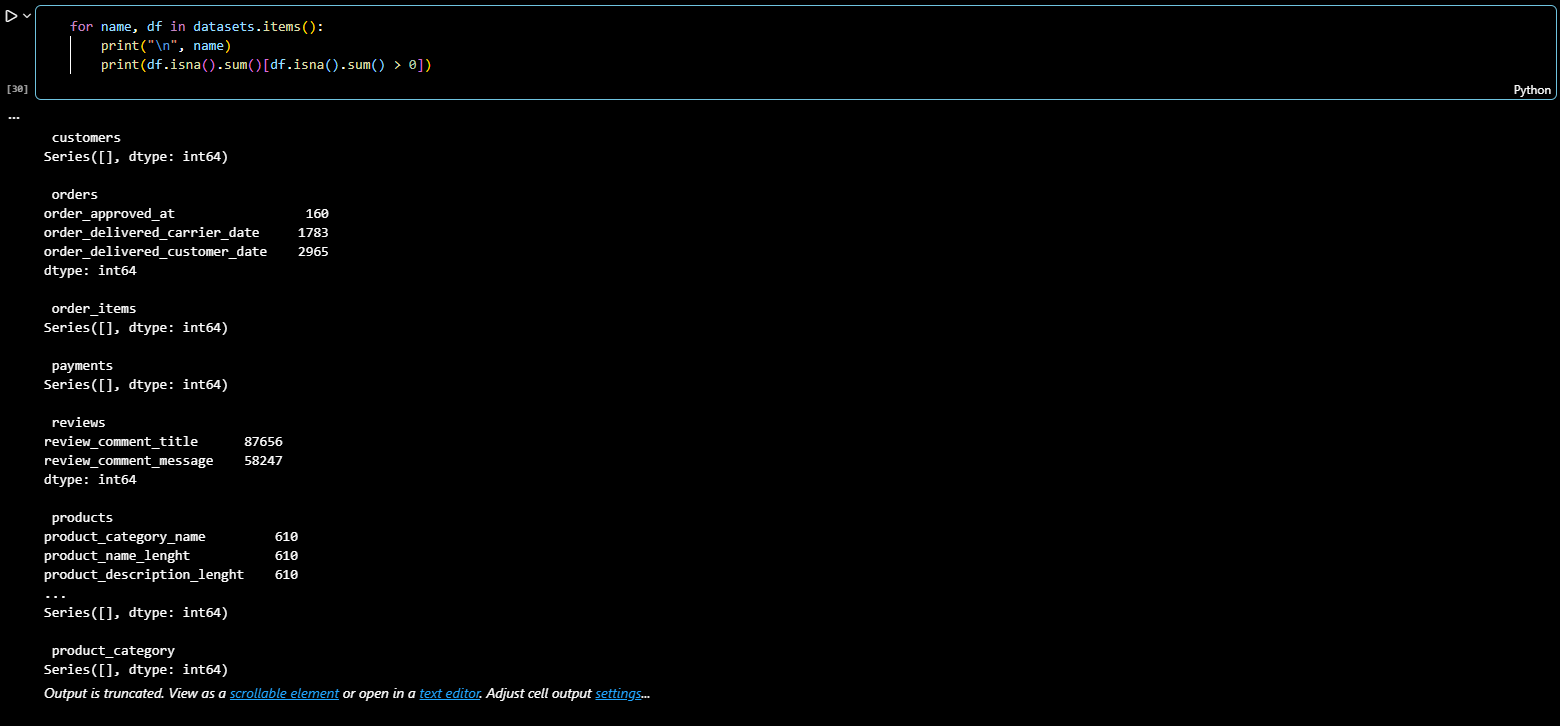
This allowed me to identify which columns contained missing information and how extensive the problem was.
However, identifying missing values does not automatically mean that they should be deleted or replaced.
This distinction is particularly important in the Olist dataset.
For example, an order that has not been delivered may legitimately have no value in its delivery date column.
Replacing that missing date with an arbitrary value could therefore introduce incorrect information into the analysis.
The correct approach is to investigate the meaning of each missing value before deciding how it should be handled.
This investigation will be part of the cleaning stage.
11. Checking for Duplicates
I also checked whether duplicate rows existed within the datasets.
I used:

This provides the number of completely duplicated rows within each DataFrame.
However, a duplicate should not automatically be deleted.
The next step is to determine whether the duplicate represents:
- an accidental duplicate record;
- legitimate repeated information;
- or a situation where the entire row is identical but the underlying business meaning is different.
Therefore, the duplicate check is part of the data investigation rather than an automatic deletion step.
12. Understanding the Dataset Relationships
The Olist dataset is relational.
The information is distributed across several datasets and connected through identifiers.
A simplified representation of some of the relationships is:
1
2
3
4
5
6
7
8
9
10
11
12
13
Customers
    |
    | customer_id
    ↓
Orders
    |
    | order_id
    ↓
Order Items
    |
    | product_id
    ↓
Products
Other datasets are connected through orders, sellers, payments and reviews.
For example, customer information is stored separately from order information.
The customer_id allows an order to be associated with the corresponding customer.
Similarly, order_id connects the orders dataset to the order items dataset.
product_id then connects an order item to a specific product.
Understanding these relationships is essential because the information required to answer a business question may be distributed across multiple datasets.
13. Understanding One to Many Relationships
One of the important things I needed to understand before combining the datasets was that not every relationship is one to one.
For example:
1
2
3
4
5
6
1 Order
   |
   ├── Order Item 1
   ├── Order Item 2
   ├── Order Item 3
   └── ...
A single order can therefore contain multiple order items.
This means that merging orders directly with order_items can increase the number of rows because one order may appear several times in the order_items dataset.
This is an important consideration when calculating metrics such as revenue.
If the relationship is not understood correctly, it would be possible to accidentally duplicate values during the merging process.
This is one of the reasons why understanding the raw structure of the data needs to happen before cleaning and analysis.
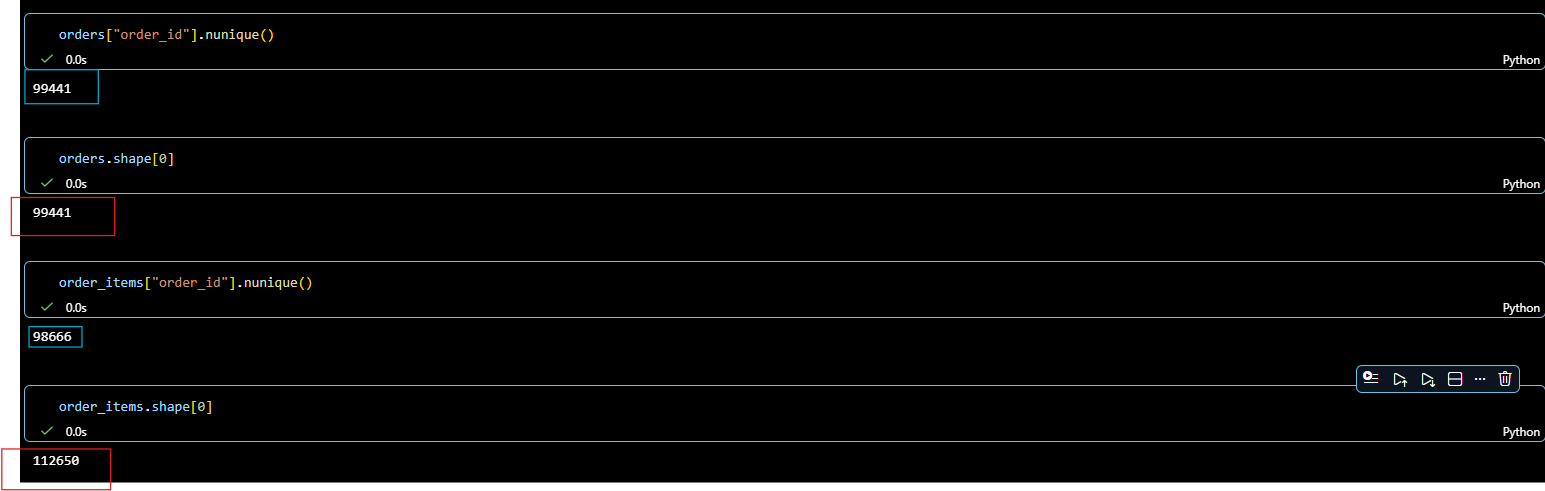
14. Checking Identifier Uniqueness
I also began investigating the main identifiers within the datasets.
For example:
1
customers["customer_id"].nunique()
I compared this with the total number of records:
1
customers.shape[0]
I performed similar checks for important identifiers such as:
1
2
3
4
customer_id
order_id
product_id
seller_id
The purpose was to understand whether an identifier was unique within its dataset and how it was used to connect information across datasets.
For example, an order_id identifies an order, but that same order can appear multiple times in the order_items dataset because an order can contain several products.
This helped me understand the structure of the database before beginning the merging process.
15. Identifying Potential Data Quality Problems
The initial investigation allowed me to identify several areas that will need attention during the cleaning stage.
Date columns
Several date and timestamp columns are currently stored as strings.
These will need to be converted to proper datetime types.
Missing values
Several columns contain missing values.
These need to be investigated individually rather than automatically removed.
Duplicates
Potential duplicate records need to be investigated to determine whether they represent genuine duplicates.
Text consistency
Some categorical and text columns may require standardisation to ensure that identical categories are represented consistently.
Identifiers
The main identifiers need to be validated so that the relationships between datasets can be trusted.
Relationships
The one-to-one and one-to-many relationships between datasets need to be understood before merging them.
These observations provide the roadmap for the next stage of the project.
16. Defining the Future Business Analysis
Understanding the data also allowed me to start defining the business questions that I eventually want the project to answer.
Rather than creating visualisations without a specific purpose, I want the final analysis to answer concrete questions.
Sales
I want to investigate:
- How does revenue evolve over time?
- What is the average order value?
- Which product categories generate the most revenue?
Products
I want to investigate:
- Which product categories sell the most?
- Which products generate the most revenue?
- Which categories have the highest order volume?
Customers
I want to investigate:
- Where are customers located?
- Which regions generate the most revenue?
- How frequently do customers purchase?
Logistics
I want to investigate:
- How long does delivery take?
- How frequently are orders delivered late?
- Does delivery performance vary between regions?
Reviews
I want to investigate:
- What is the average review score?
- Does delivery performance affect customer satisfaction?
- Are late deliveries associated with lower review scores?
These questions will guide the cleaning, feature engineering and exploratory analysis stages of the project.
17. Why This Initial Investigation Matters
At first glance, importing CSV files into Pandas may seem like a simple technical step.
However, the quality of the analysis that follows depends heavily on understanding the data correctly at this stage.
For example, if I incorrectly treat a date as a string, I cannot reliably calculate delivery durations.
If I do not understand the relationship between orders and order items, I could accidentally duplicate values when merging datasets.
If I remove missing values without understanding why they are missing, I could remove valid business information.
If I do not validate identifiers, I could create incorrect relationships between datasets.
The purpose of this stage is therefore not simply to look at the data.
It is to understand the structure and limitations of the data before making analytical decisions.
18. Current Project Progress
At the end of this first stage, the workflow looks like this:
1
2
3
4
5
6
7
8
9
10
11
12
13
14
15
16
17
18
19
20
21
Raw Olist CSV files
        ↓
Import into Pandas
        ↓
Inspect dataset dimensions
        ↓
Inspect rows and columns
        ↓
Check data types
        ↓
Identify date columns
        ↓
Check missing values
        ↓
Check duplicates
        ↓
Investigate identifiers
        ↓
Understand relationships
        ↓
Identify data quality issues
The data has not yet been cleaned.
Instead, I now have a clear list of the issues that need to be addressed.
19. What Comes Next?
The next stage of the project will focus on data cleaning and validation.
The objective will be to transform the raw datasets into reliable datasets that can be used for analysis.
The next stage will include:
- converting date and timestamp columns to datetime;
- investigating missing values;
- deciding how each missing value should be handled;
- investigating duplicates;
- standardising text and categorical columns;
- validating identifiers;
- checking relationships between datasets;
- preparing the data for merging.
After the cleaning process, I will then create new variables that will make the data more useful for business analysis.
Examples will include:
1
2
3
4
5
6
7
order_value
delivery_days
delivery_delay_days
is_late
order_year
order_month
order_weekday
These variables will later allow me to investigate sales performance, customer behaviour, delivery performance and customer satisfaction.
Conclusion
The first stage of the Olist project was dedicated to understanding the raw data before modifying it.
I imported the different CSV files into Pandas and investigated their dimensions, structure, data types, missing values, duplicates and identifiers.
I also began understanding the relationships between the datasets and the one-to-many relationships that will need to be considered when merging them.
This initial investigation revealed several issues that need to be addressed before analysis can begin, particularly around date formats, missing values, duplicates, categorical consistency and dataset relationships.
The important lesson from this stage is that data analysis does not begin with a chart.
It begins with understanding the data.
The next stage will therefore move from:
“What data do I have?”
to:
“How can I make this data reliable and ready for analysis?”
That will be the focus of Part 2: Cleaning and Validating the Olist Data with Python.