Power BI Project:Superstore Data Preparation & Modeling

Introduction
Before building any dashboard in Power BI, the foundation has to be solid. A well-structured data model is what separates a report that works from one that actually scales, performs, and gives reliable results. In this post, I walk through everything that happened before the first visual was placed: cleaning the raw Superstore dataset, creating dimension tables, and building the star schema that powers the entire report.
The raw Superstore file is a flat table. Every row contains information about an order, a customer, a product, a region, and a date, all mixed together in a single sheet. That structure works fine for a spreadsheet, but it is not suited for analytical modeling. The goal of this preparation phase was to reshape that flat file into a proper relational model made of one fact table and several dimension tables, connected through clean and intentional relationships.
Part 1 Cleaning the Source Dataset
The Source Table (SUPERSTORE)
The first step was to load the raw CSV file into Power Query. This created the base SUPERSTORE query, which serves as the untouched reference from which all other tables are derived. The source is never modified directly. Every transformation happens on a reference or duplicate of this query, which ensures the original data remains intact throughout the process.
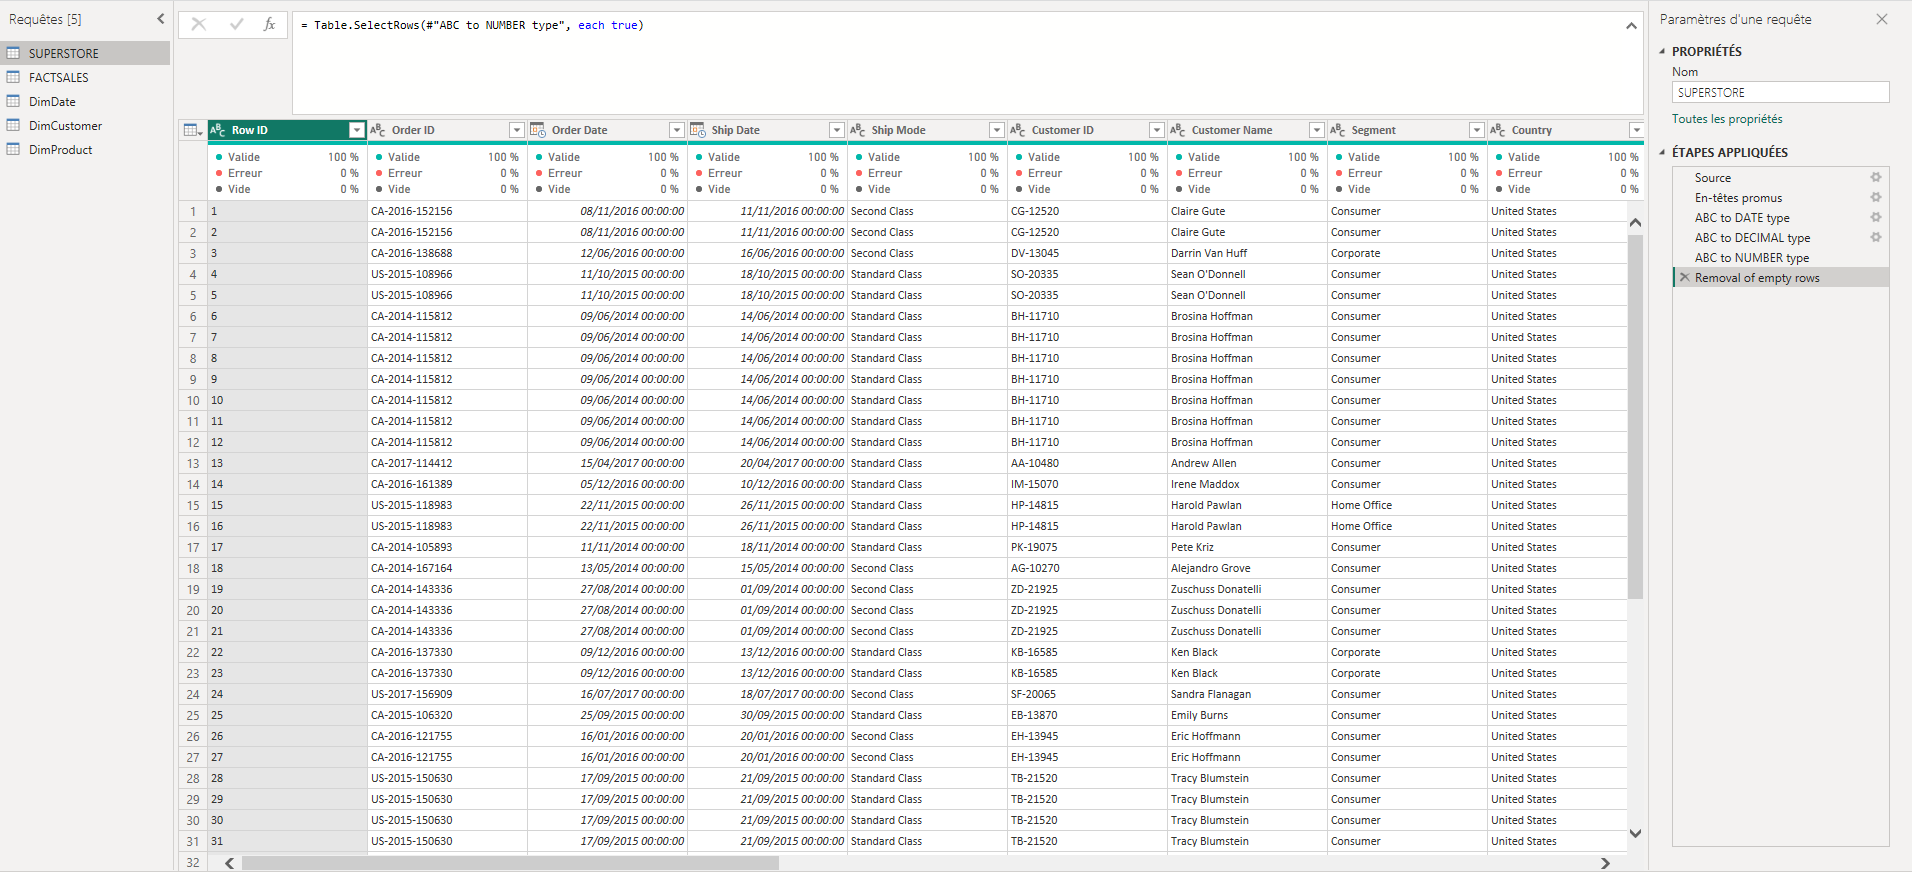
The steps applied to the source query were the following:
Source - connects to the raw CSV file.
En-têtes promus - promotes the first row as column headers, since the raw file does not automatically detect them.
ABC to DATE type - converts the Order Date and Ship Date columns from text format to proper date types. This is critical because Power BI cannot build time intelligence or date hierarchies on text columns.
ABC to DECIMAL type - converts numeric columns like Sales, Profit, and Discount from text to decimal numbers so they can be aggregated in measures.
ABC to NUMBER type - converts integer columns like Quantity and Row ID to whole number format.
Removal of empty rows - this is the step that appeared as a “Filtered Rows” step. Power Query uses Table.SelectRows with the condition “each true” after removing empty rows, which filters out any rows where all values are null. This typically happens when the source file has trailing blank lines at the bottom, which is common with CSV exports.
Each of these steps is essential. Wrong data types are one of the most common causes of broken measures and incorrect aggregations in Power BI. Getting them right at the source level means every derived table inherits clean, reliable data.
The FACTSALES Table
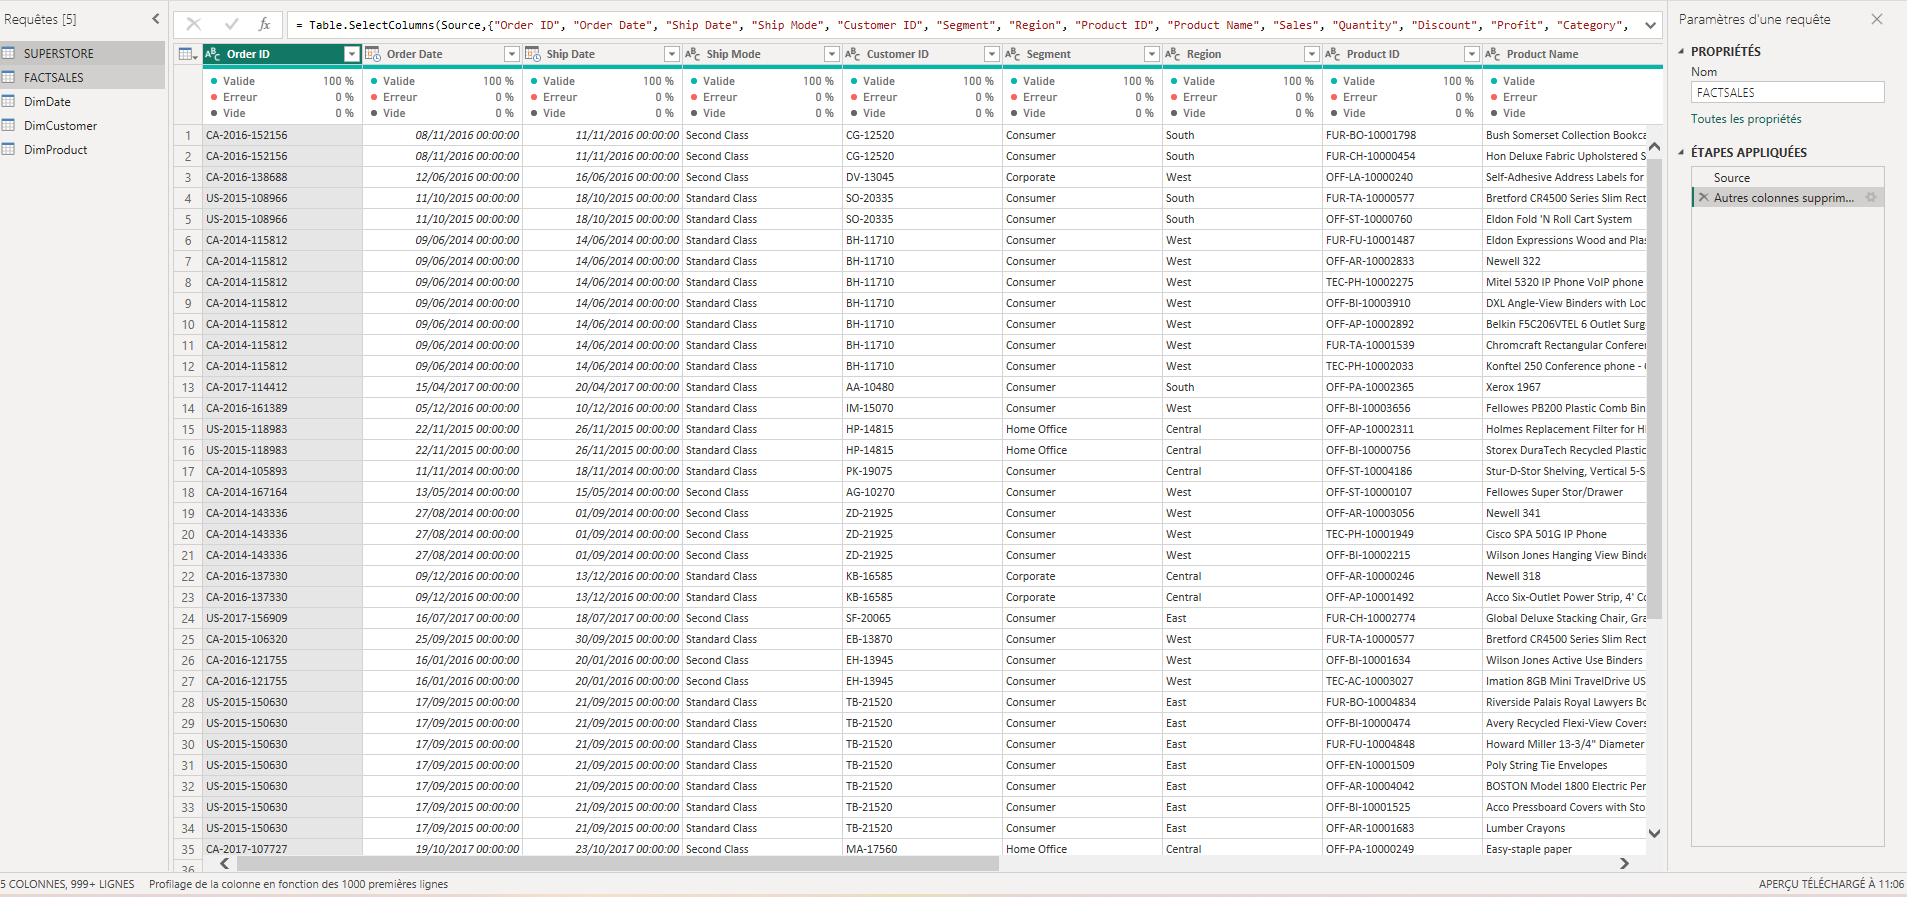
The FACTSALES table is a reference of the cleaned SUPERSTORE query. From that reference, unnecessary columns were removed using Table.SelectColumns, keeping only the fields relevant to transactions: Order ID, Order Date, Ship Date, Ship Mode, Customer ID, Segment, Region, Product ID, Product Name, Sales, Quantity, Discount, Profit, and Category.
This table is the core of the model. It contains one row per order line and holds all the measurable facts (Sales, Profit, Discount, Quantity) alongside the foreign keys that link to each dimension table (Customer ID, Product ID, Order Date).
Keeping only the necessary columns reduces the file size and keeps the model clean. Any column that belongs to a dimension has no place in the fact table once the relationships are in place.
Part 2 Creating the Dimension Tables
DimCustomer
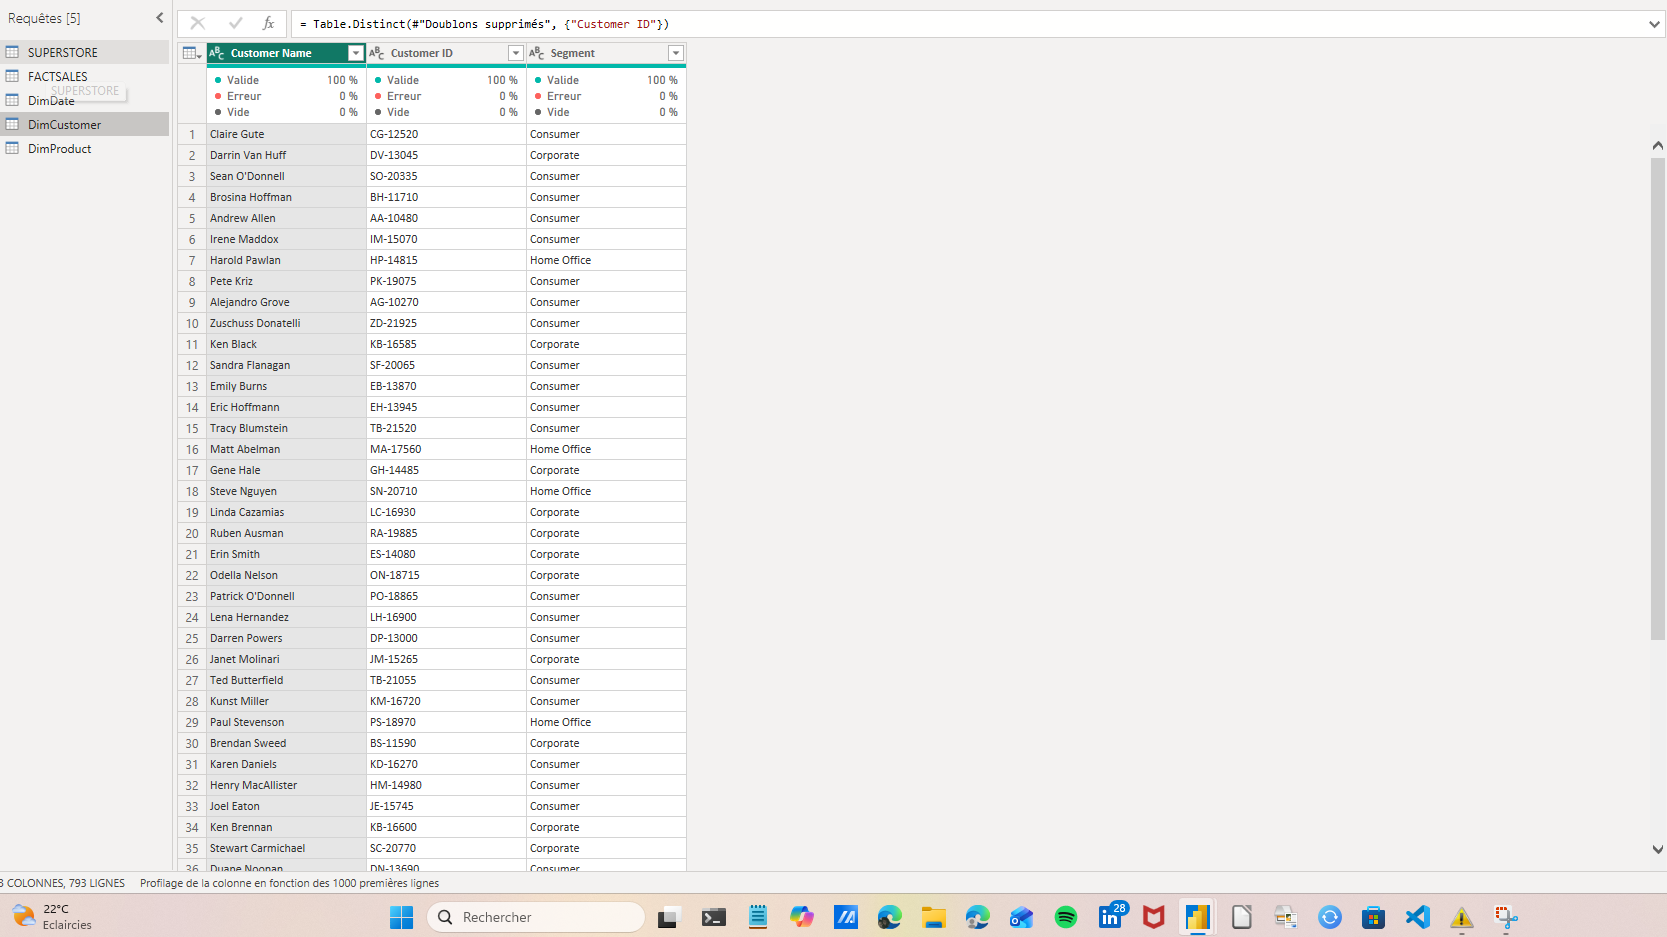
The DimCustomer table was created by referencing FACTSALES and keeping only three columns: Customer Name, Customer ID, and Segment. A Table.Distinct step was then applied on Customer ID to remove duplicate rows and keep only one record per unique customer.
The result is a clean lookup table with 793 unique customers, each with their associated segment (Consumer, Corporate, or Home Office). This table will be used to filter and group data by customer in the report.
DimProduct
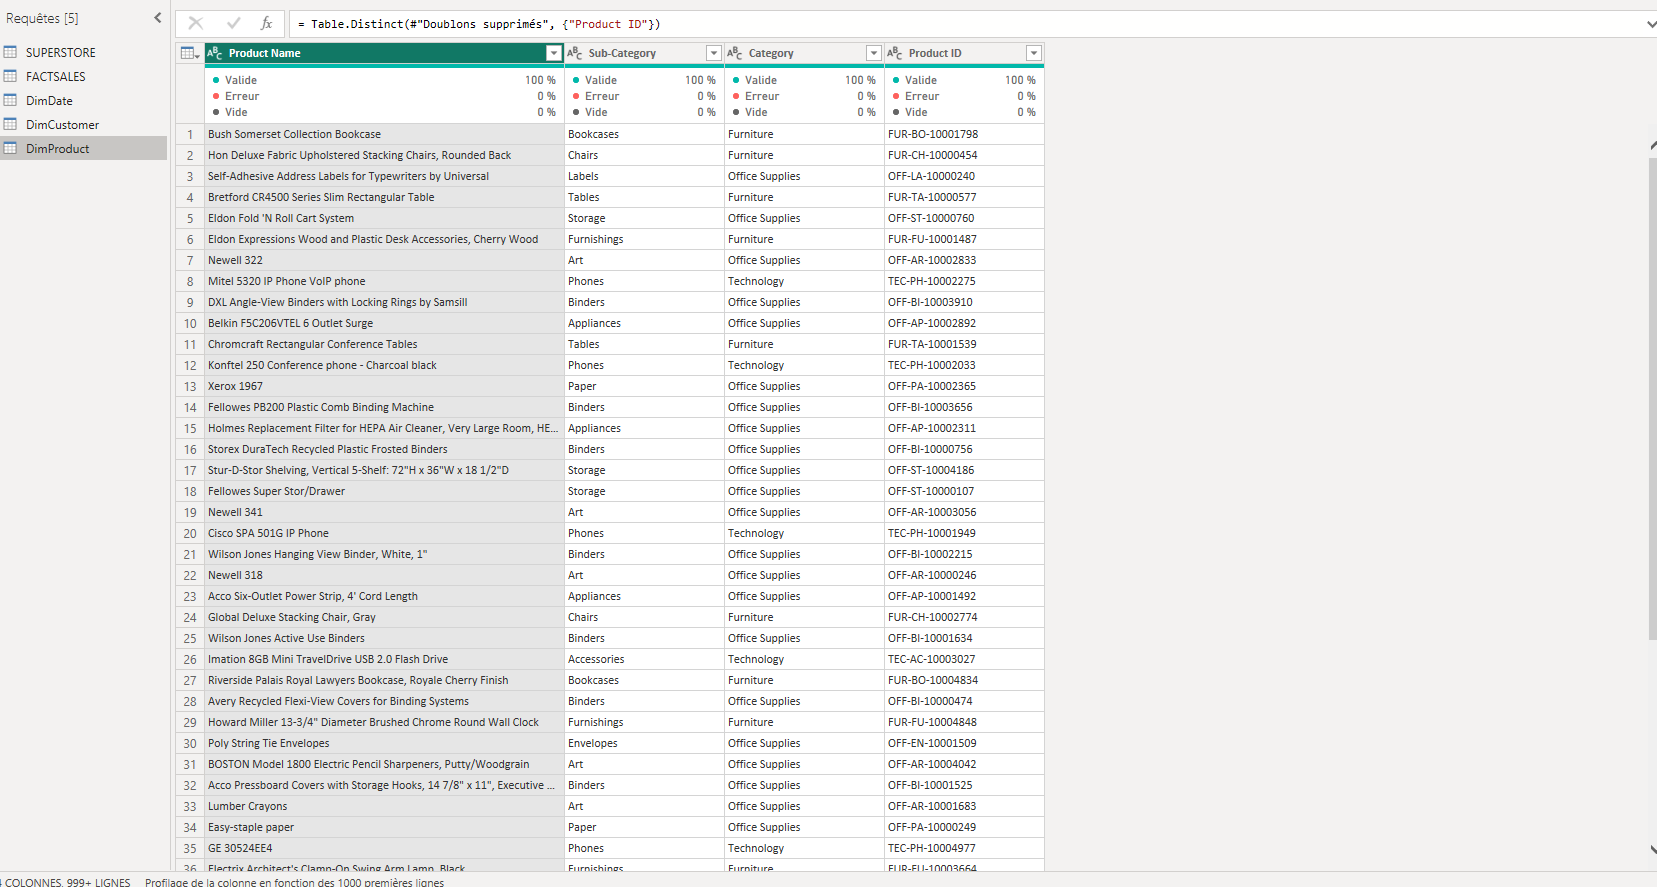
DimProduct follows the same logic. It references FACTSALES, keeps Product Name, Sub-Category, Category, and Product ID, then applies Table.Distinct on Product ID to deduplicate. The result is a product catalog where each product appears exactly once with its full classification hierarchy.
This table allows the report to slice sales and profit by Category and Sub-Category without duplicating that information inside the fact table.
DimDate
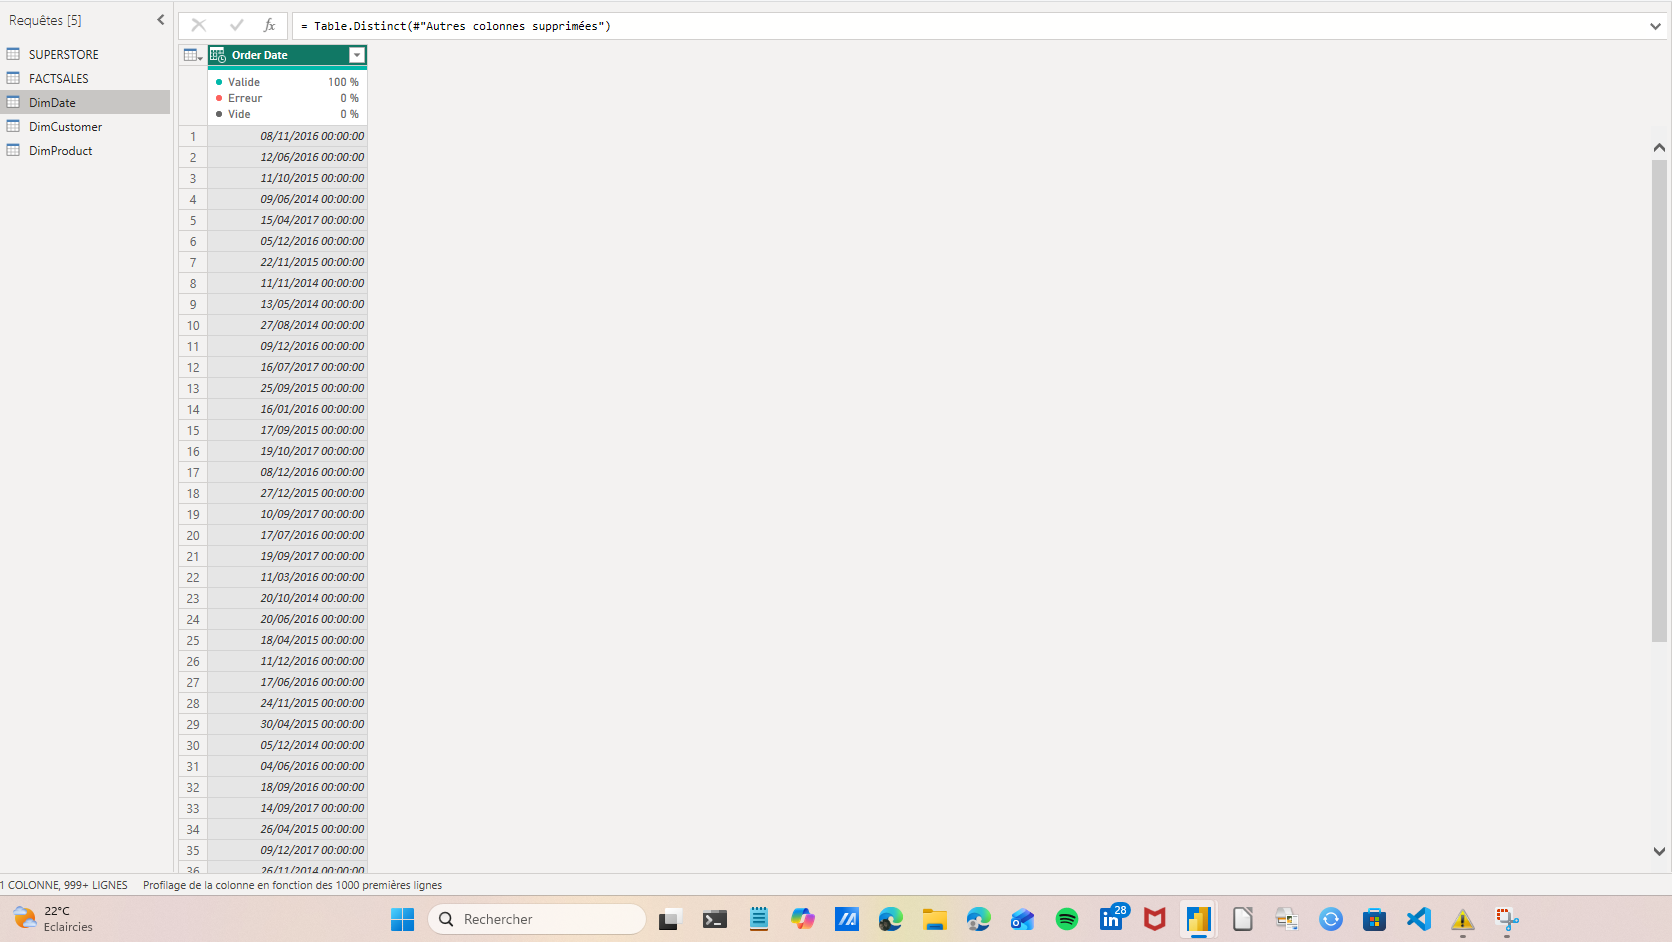
DimDate was created by referencing FACTSALES, keeping only the Order Date column, and applying Table.Distinct to get one row per unique date. This gives a list of all dates present in the dataset.
A proper date table ideally covers every calendar day in the range (not just transaction dates), and includes columns like Year, Month Number, Month Name, and Quarter to support time intelligence. The Month Name and Month Number columns visible in the model view confirm that these were added to support the monthly trend visuals in the report.
Part 3 Building the Star Schema
The Model
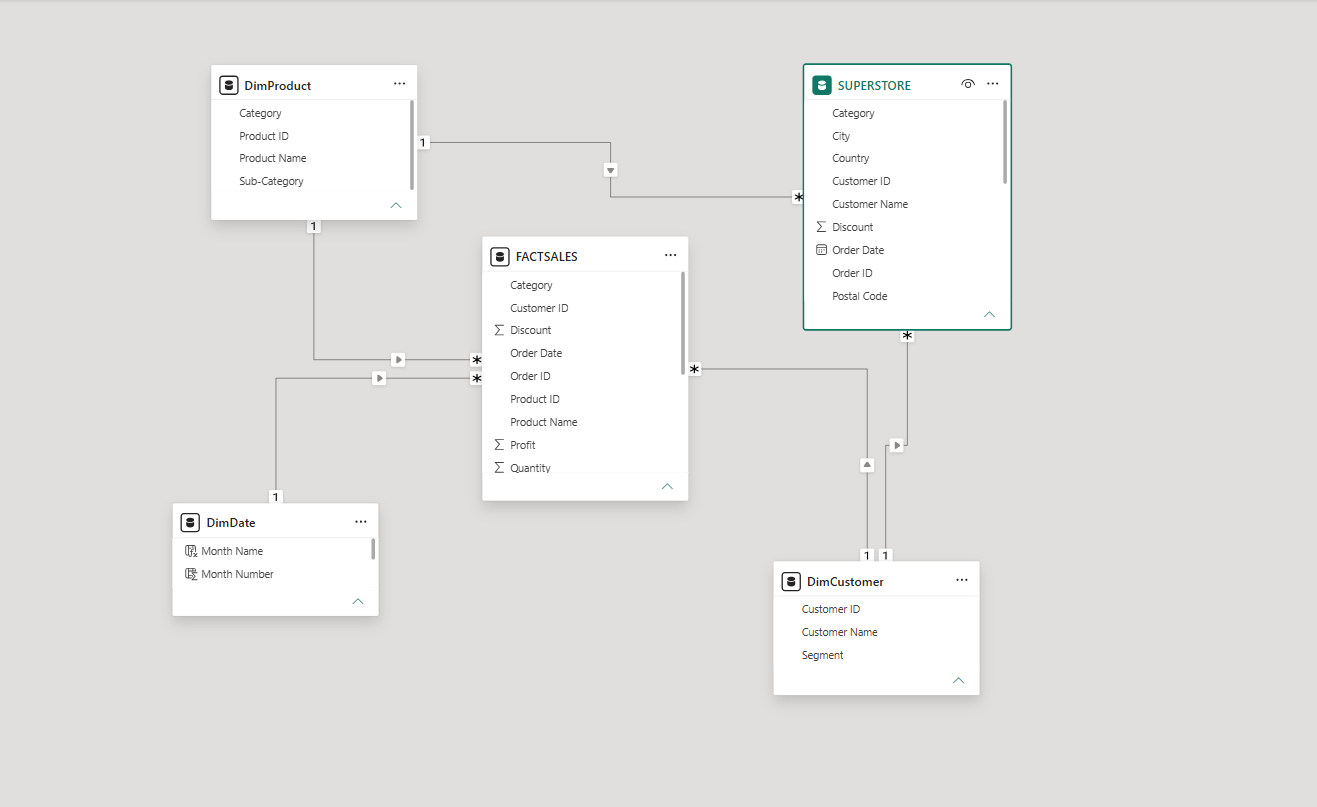
With all four tables ready (FACTSALES, DimCustomer, DimProduct, DimDate), the next step was to build the relationships in the Model view. The target structure is a star schema: one central fact table connected to multiple dimension tables, each linked by a shared key.
The relationships defined in this model are the following:
- FACTSALES[Customer ID] connected to DimCustomer[Customer ID]
- FACTSALES[Product ID] connected to DimProduct[Product ID]
- FACTSALES[Order Date] connected to DimDate[Order Date]
Each of these is a one-to-many relationship (1 on the dimension side, many on the fact side), which is the standard and correct configuration for a star schema in Power BI.
The SUPERSTORE source table remains visible in the model but is hidden from report view since it is only used as a source for the other queries and is not meant to be used in visuals directly.
The Relations and Their Importance
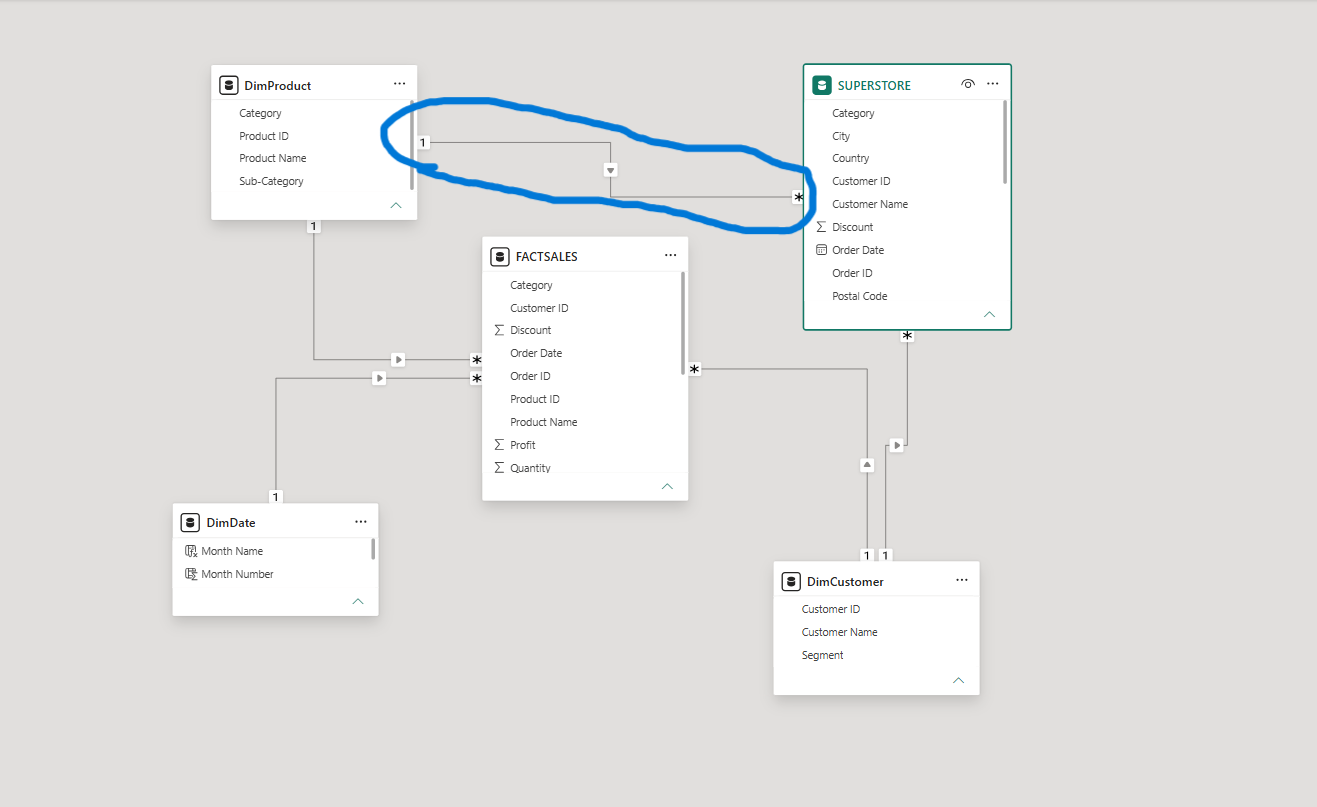
Relationships are what allow Power BI to filter across tables automatically. When a slicer on the report filters by Segment (from DimCustomer), Power BI uses the relationship between DimCustomer and FACTSALES to filter the corresponding sales rows. Without relationships, every measure would need to be written with explicit filter logic in DAX, which is far more complex and error-prone.
Getting the cardinality right matters. A many-to-many relationship between two tables that should be one-to-many will produce incorrect filter propagation and unreliable results. Using a deduplicated dimension table on the “one” side of each relationship is what guarantees the cardinality is correct.
The Filter Directions

Each relationship has a filter direction, indicated by the arrow in the model view. In this model, all relationships use single direction filtering, meaning filters flow from the dimension table toward the fact table.
This is the recommended default for star schemas. It means that selecting a value in a dimension (for example, a product category in DimProduct) will filter the rows in FACTSALES accordingly. The reverse does not happen automatically, which prevents ambiguous and circular filter paths that can break measures.
The two relationships involving DimProduct and DimDate show their arrows pointing toward FACTSALES, confirming that the filter direction is correctly set from the dimension to the fact table.
Conclusion
The data preparation phase is the least visible part of a Power BI project but arguably the most important. Every visual, every measure, and every insight in the report depends on the quality of what was built here.
The key decisions made in this phase were the following. The source dataset was never modified directly, all transformations were applied to references and duplicates. Data types were corrected at the source level so that all derived tables inherit clean formats. Dimension tables were deduplicated to guarantee the integrity of one-to-many relationships. The star schema was built with single-direction filters to ensure predictable and correct filtering across the model.
A clean model is what makes DAX measures simple to write, reports fast to load, and results reliable to trust. Taking the time to structure the data properly before touching a single visual is what separates a well-built Power BI report from one that causes problems down the line.
The next post will cover the DAX measures written on top of this model and how the three report pages were built.
Thank you for taking the time to explore this project. It forms part of my data analytics portfolio and showcases my ability to transform business data into meaningful insights using Power BI. Feedback and suggestions are always welcome. *This project was built with Power BI Desktop using the public Superstore sample dataset, as part of my ongoing data portfolio.